

You know, like McDowells. I don’t actually care what color my shells are. There are principals involved. Principalities!

Edit: Some salty commenters here. This isn’t my graph, just one I grabbed. Notes aren’t mine.
I’m a huge proponent for inflation adjusted livable minimum wage- which should be close to $30 an hour these days. Also hugely worried about our housing cost trends.
I’m only pointing out that expecting games to cost 40-60 for life is a little silly- yall still paying $.10 for a loaf of bread? I remember when games inched from $40 to $60 and everyone lost their minds- no one complains about it anymore. Don’t wanna pay retail? Wait for sales, bundles, used copies.
Okay, but now do housing and groceries and you’ll see why people don’t have extra money laying around for another Nintendo and its Mario kart.
Economics is significantly more complicated than a bar graph of inflation-adjusted video game price tags lol. Hell, even just value of each game in their respective release time period is more complicated than that. I doubt there’s anything unique to this new game (other racing games have done the open world thing several times starting like 15 years ago), but the kart racer genre itself was new back in the 90s.
This is a valuable way of seeing how prices have changed in different ways for different categories, just since 2000.
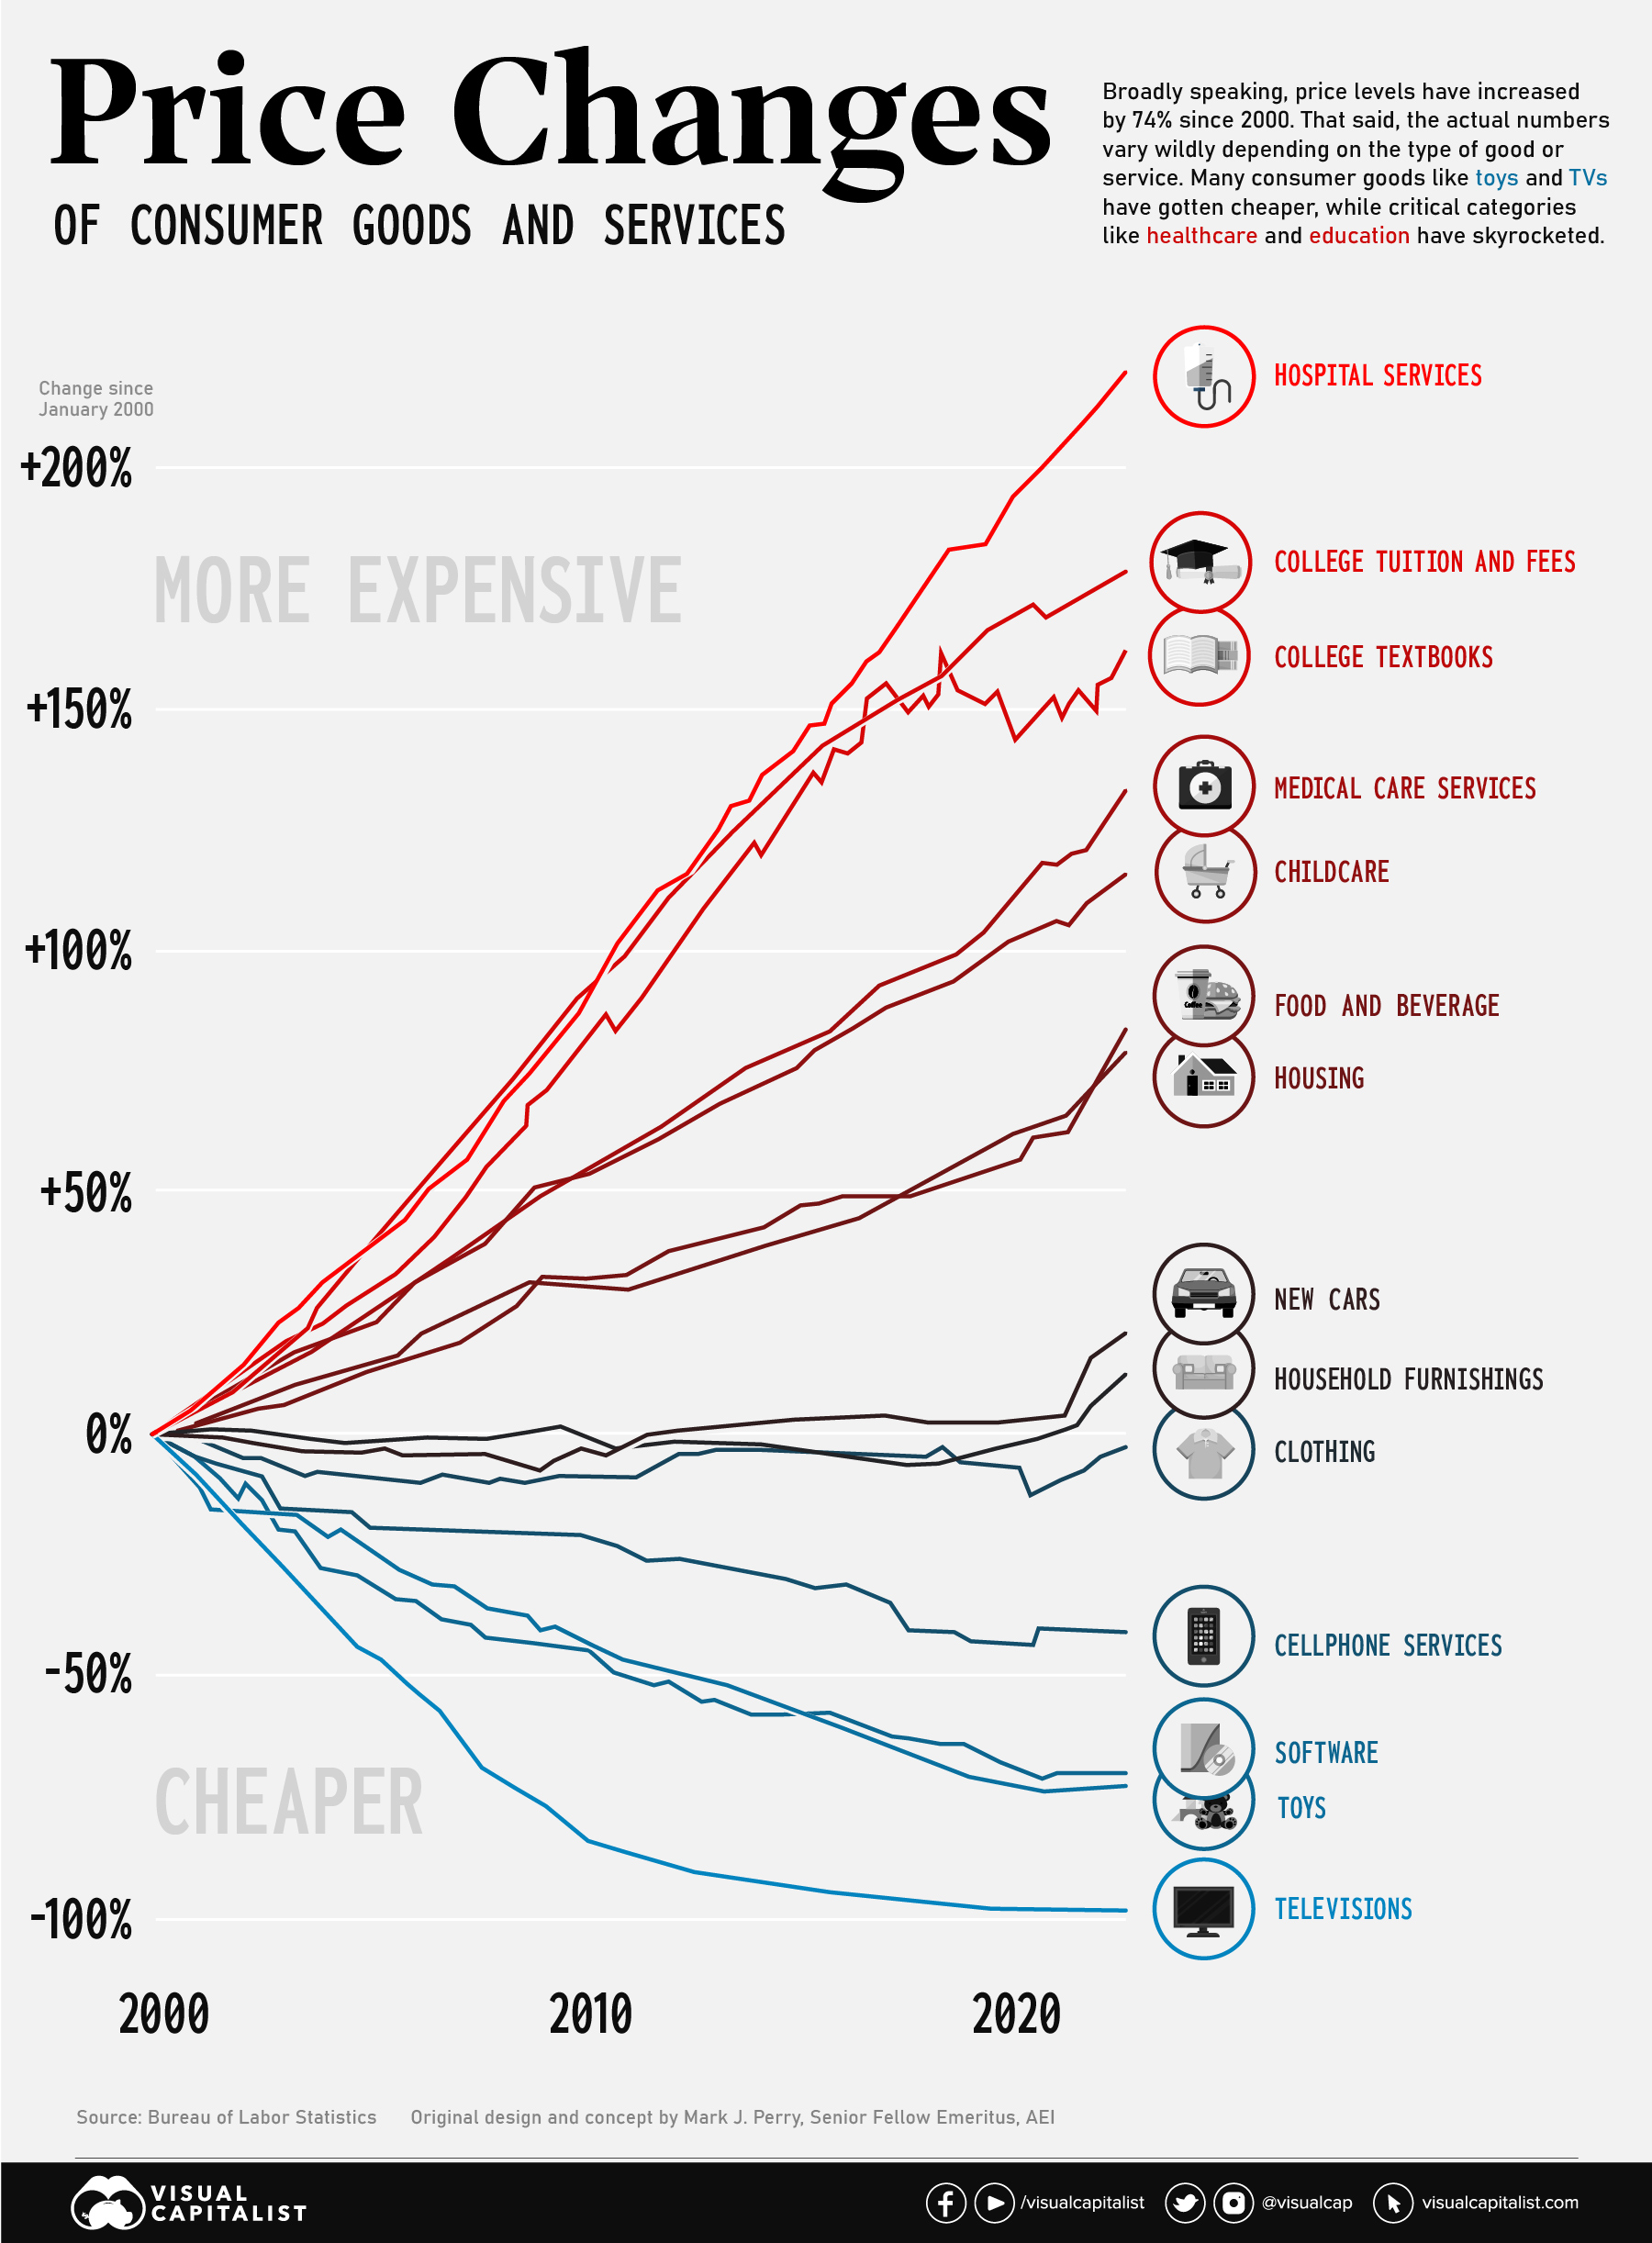
Why are TV’s listed as “100% cheaper”? I’m a little confused about that number.
Looking up the source, they state: “At the turn of the century, a flat screen TV would cost around 17% of the median income of the time ($42,148). In the early aughts though, prices began to fall quickly. Today, a new TV will cost less than 1% of the U.S. median income ($54,132).”
So a Flat screen TV used to cost around $7165, and does now cost around $541, which is about 7.5% of the original value. That means a deflation by 92.5%.
